Integrating Remote Sensing Data with GIS for Environmental Monitoring
Remote sensing and GIS (Geographic Information Systems) are powerful tools on their own, but when combined, they transform how we monitor and manage environmental conditions. From tracking deforestation and urban expansion to detecting water quality changes and climate impacts, the integration of remote sensing data with GIS allows scientists, governments, and environmental managers to make more informed decisions.
Combining satellite imagery with spatial analysis in GIS provides a dynamic, scalable way to monitor environmental changes in real time and over long periods. This blog breaks down how this integration works, its applications, benefits, and limitations—helping you see why it’s become essential in environmental science.
How Remote Sensing and GIS Work Together
To understand the power of their integration, it’s important to look at what each technology does on its own and how they complement each other in environmental applications.
What Is Remote Sensing?
Remote sensing involves collecting data about Earth’s surface without direct contact, usually through satellites, drones, or aircraft. Sensors onboard these platforms capture data in various spectral bands, revealing information not visible to the naked eye, such as vegetation health or moisture content.
There are two main types:
- Passive sensors detect natural energy, usually reflected sunlight (e.g., Landsat imagery).
- Active sensors emit their own signal and measure the reflection (e.g., radar and LiDAR).
What Is GIS?
GIS is a system used to store, manipulate, analyze, and visualize spatial (geographic) data. Think of it as a smart map that can hold layers of data—like population density, soil types, or temperature patterns—and analyze relationships between them.
When remote sensing data feeds into a GIS platform, it becomes a map-ready layer that can be analyzed, updated, and combined with other spatial datasets for deep environmental insights.
Applications of Remote Sensing and GIS in Environmental Monitoring
Together, remote sensing and GIS are used in nearly every area of environmental monitoring. Their integration is particularly valuable because it offers consistent, up-to-date, and often real-time information over vast geographic areas.
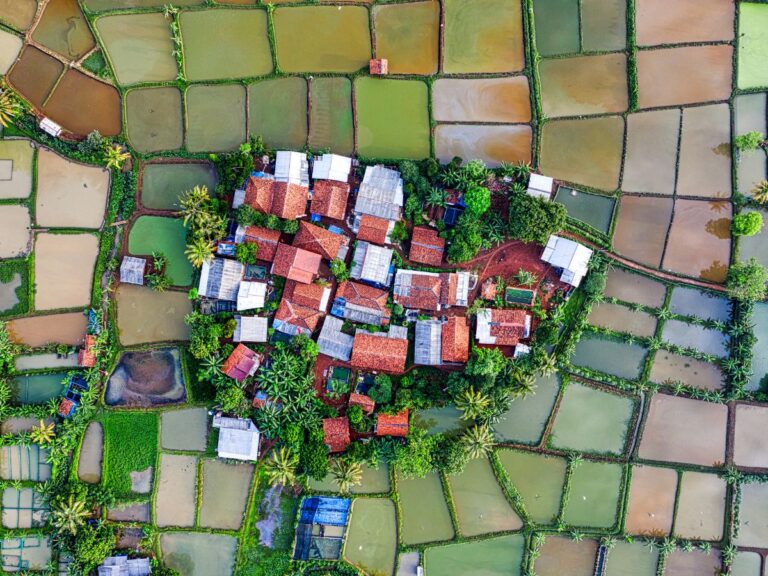
1. Deforestation and Land Cover Change
Satellites like MODIS and Landsat provide high-resolution images used to detect forest loss, track illegal logging, and monitor natural reforestation. When this data is layered in GIS, analysts can:
- Compare year-over-year tree cover loss
- Detect hotspots of activity in protected areas
- Assess the impact of agricultural expansion on biodiversity
GIS enables time-series analysis of remote sensing data, showing where and how fast land cover is changing.
2. Water Quality and Hydrological Monitoring
Remote sensing can detect sediment loads, algae blooms, and changes in water temperature or turbidity. When integrated into a GIS:
- Water quality parameters can be linked to upstream land use
- Watersheds can be modeled to predict pollution sources
- Flood-prone zones can be mapped for emergency planning
By overlaying rainfall, soil, and topographic data, GIS tools give water resource managers a full picture of a region’s hydrological health.
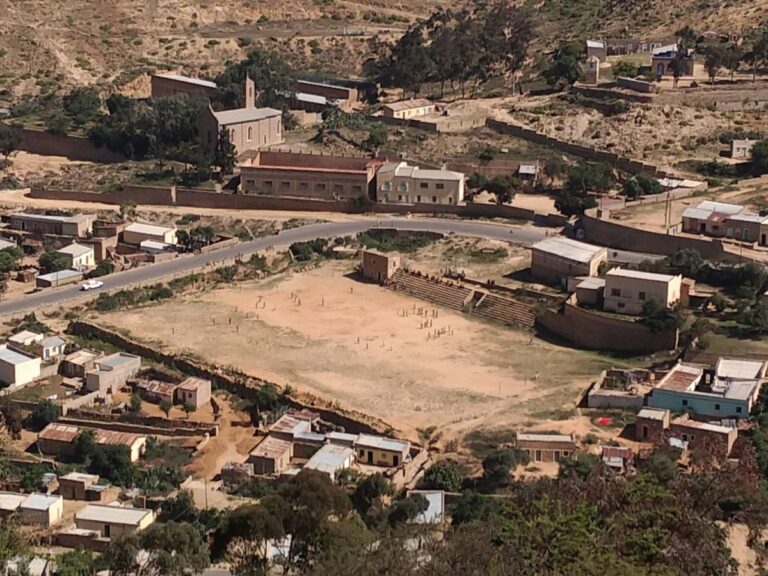
3. Urban Sprawl and Land Use Planning
Cities grow rapidly, often without proper planning. Using time-stamped remote sensing imagery in GIS helps planners:
- Track urban growth patterns over decades
- Identify encroachment on natural areas or agricultural land
- Plan for future zoning, roads, or green spaces
This integration supports smarter urban development that balances growth with sustainability.
4. Climate and Disaster Impact Assessment
Remote sensing detects temperature changes, glacier retreat, and sea-level rise indicators, while GIS contextualizes these changes by mapping vulnerability and risk.
Key uses include:
- Mapping wildfire extent and severity
- Assessing drought conditions by combining soil moisture, NDVI, and rainfall data
- Analyzing hurricane damage with pre- and post-event satellite imagery
GIS not only visualizes this data but also links it to population, infrastructure, and emergency resources.
5. Biodiversity and Habitat Monitoring
Wildlife conservation efforts benefit from remote sensing data showing changes in habitat quality and fragmentation. GIS tools then:
- Map species distribution relative to environmental factors
- Identify corridors and barriers to animal movement
- Model future habitat under climate change scenarios
This dual approach supports strategic conservation planning and real-time response efforts.
Key Components of the Integration Process
Blending remote sensing with GIS isn’t automatic—it requires specific steps and tools to ensure the data is usable and meaningful.
H3: Preprocessing Remote Sensing Data
Before analysis, satellite data often needs:
- Georeferencing to match real-world coordinates
- Radiometric correction to remove sensor noise
- Atmospheric correction to account for haze or clouds
Once clean, it can be layered within GIS platforms.
H3: Creating and Using Layers in GIS
GIS software allows users to build custom maps with multiple layers. These might include:
- NDVI (Normalized Difference Vegetation Index) maps from satellite data
- Soil types from USDA databases
- Flood risk zones generated from topographic models
By combining layers, users can run powerful queries—for example: “Show all agricultural fields at risk of flooding within the next 10 years.”
H3: Spatial Analysis and Modeling
GIS isn’t just about making maps—it’s an analytical engine. When combined with remote sensing inputs, GIS supports:
- Buffer analysis to assess impacts near protected areas
- Change detection over time using multi-date imagery
- Predictive modeling for land use or climate impacts
This layered, analytical power turns raw imagery into actionable environmental intelligence.
Advantages of Integrating Remote Sensing and GIS
Bringing these tools together unlocks capabilities that neither could offer alone.
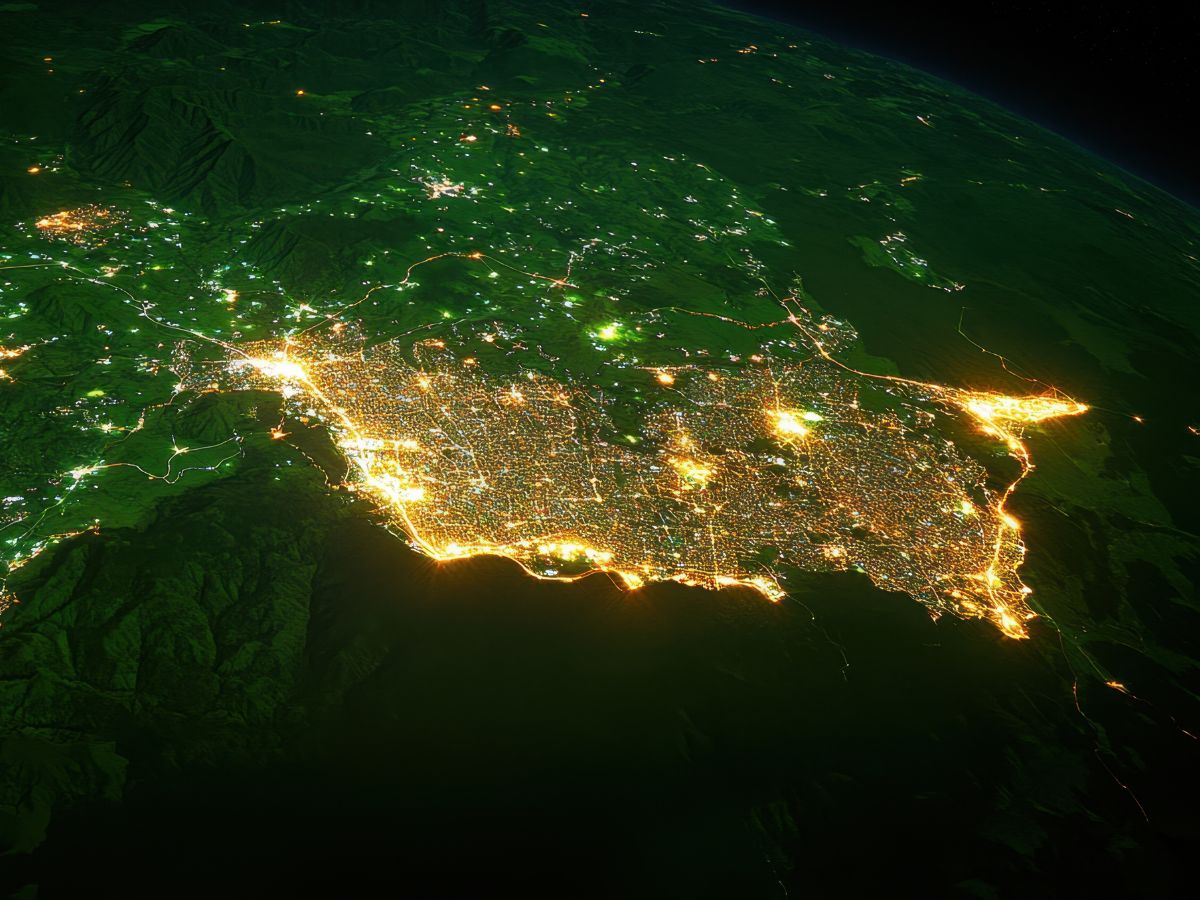
1. Large-Scale, Real-Time Monitoring
Remote sensing provides regular, global data at varying scales (10m, 30m, 250m). When fed into GIS systems, this supports constant monitoring across national parks, coastlines, or urban regions.
2. Cost-Effective Environmental Management
In regions where field surveys are expensive or dangerous, satellite and GIS tools provide affordable alternatives. For example, governments can use them to:
- Monitor illegal mining
- Track erosion in coastal zones
- Estimate crop yields without physical inspections
3. Decision Support for Policy and Planning
Environmental managers and policymakers use integrated outputs to make informed decisions, such as:
- Where to focus conservation funding
- How to design wildfire prevention zones
- Whether to issue air quality warnings
4. Public Engagement and Education
Interactive GIS dashboards built on remote sensing data (like those from NASA or the EPA) help educate the public and involve communities in conservation.
Challenges and Limitations to Consider
Despite the power of this integration, there are limitations that environmental teams need to navigate.
Data Complexity
Remote sensing data comes in various formats (e.g., GeoTIFF, HDF, NetCDF) and sizes. Processing and managing this data requires skilled personnel and high computing capacity.
Temporal Gaps and Weather Dependency
Cloud cover and satellite revisit rates can create gaps in coverage. Certain sensors only pass every 8 to 16 days, which can delay analysis of fast-moving events like floods or fires.
Ground Truthing Still Matters
Field data remains critical. Remote sensing provides a broad view, but local measurements are necessary to validate models and correct misclassifications (e.g., distinguishing between crops and shrubs).
Legal and Ethical Issues
Data privacy can be a concern, especially with drone-based monitoring. Plus, there may be international restrictions on using high-resolution imagery for certain areas.
Tools and Platforms Commonly Used
Integrating GIS and remote sensing often involves specialized software, including:
| Tool/Platform | Purpose | Notes |
|---|---|---|
| ArcGIS Pro | Full-featured GIS platform | ESRI’s flagship desktop software, widely used in environmental sectors |
| QGIS | Open-source GIS | Free alternative to ArcGIS, with strong remote sensing plugins |
| Google Earth Engine | Cloud platform for satellite analysis | Enables processing of petabytes of satellite imagery without local downloads |
| SNAP (Sentinel Application Platform) | Remote sensing preprocessing | Built for Sentinel data, includes atmospheric corrections |
| ENVI | Image processing and classification | Specialized in analyzing remote sensing data |
These tools help automate analysis, support collaboration, and allow advanced modeling of environmental processes.
Case Study Examples: Real-World Impact
Here are two brief examples that show how GIS and remote sensing make a difference in environmental monitoring:
Drought Monitoring in California
Using MODIS-derived NDVI and soil moisture data in GIS, California water authorities monitor drought severity across counties. This data feeds into agricultural water rationing and wildfire prevention strategies.
Coastal Erosion Mapping in Louisiana
Remote sensing from satellites and aerial drones tracks shoreline retreat along the Gulf Coast. GIS platforms model future erosion patterns based on sea-level rise, guiding investments in levees and wetlands restoration.
Integrating Remote Sensing Data with GIS for Environmental Monitoring—What’s Next?
The future of environmental monitoring lies in deeper, smarter integration. As satellites become more advanced and GIS platforms incorporate AI and machine learning, the insights we can derive will become faster, more precise, and increasingly automated.
Expect to see more predictive modeling, real-time dashboards, and citizen science platforms built on this integration—empowering communities to respond faster to environmental challenges.
This also opens the door to new topics such as “Using AI to Predict Environmental Change with Remote Sensing and GIS”—a natural next step in this rapidly evolving field.