Using GIS to Understand Service Access in Kenyan Settlements
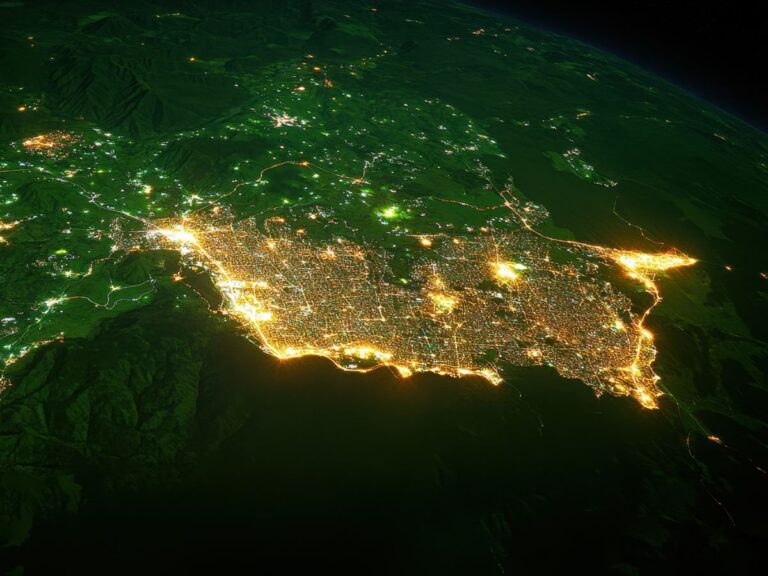
In Kenya’s rapidly growing urban and peri-urban areas, access to essential services like water, sanitation, healthcare, and education is uneven and often poorly documented. Geographic Information Systems (GIS) provide a powerful way to map, visualize, and analyze service access across these diverse settlements. GIS helps decision-makers see where gaps exist and prioritize resources more efficiently. From informal settlements in Nairobi to remote villages in Turkana, spatial data can reveal patterns that would otherwise be hidden in spreadsheets or verbal reports.
This blog explores how GIS is transforming the understanding of service access in Kenyan settlements by highlighting practical uses, tools, and case examples. Whether you’re a planner, development practitioner, or researcher, spatial analysis offers actionable insights for inclusive service delivery.
Mapping Service Inequity: Why Location Matters
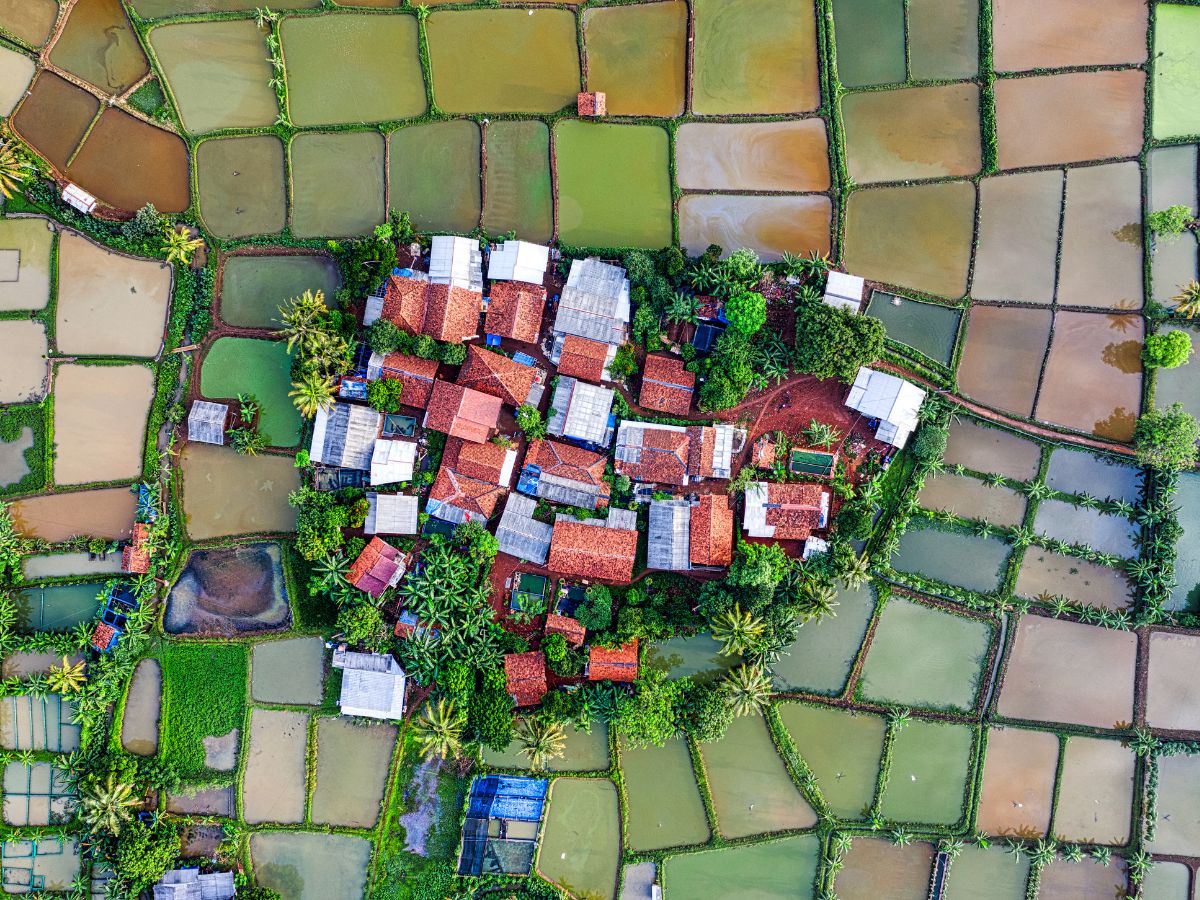
Where people live often determines the quality and availability of services they receive. GIS allows us to overlay different layers of information—like population density, road networks, and service points—to see who is underserved and why.
Spatial mapping reveals how services cluster around certain areas while neglecting others just kilometers away. For instance, a GIS analysis might show that schools and clinics are concentrated along major roads in Nairobi but sparse in the informal settlements tucked between them. These invisible patterns become obvious when viewed from a spatial perspective.
Understanding Access Gaps Through Spatial Layers
By combining several types of datasets, GIS helps identify both visible and hidden gaps in service delivery:
- Population density maps overlaid with service locations can show which areas are over- or under-served.
- Road accessibility layers highlight how physical geography (rivers, hills) and infrastructure (paved roads, footpaths) affect travel time to services.
- Administrative boundaries allow comparisons between counties or wards for resource allocation and equity assessment.
In Kibera, one of Africa’s largest informal settlements, GIS has helped NGOs visualize the distance residents must travel for clean water or medical care, guiding new water kiosks and mobile health units to underserved zones.
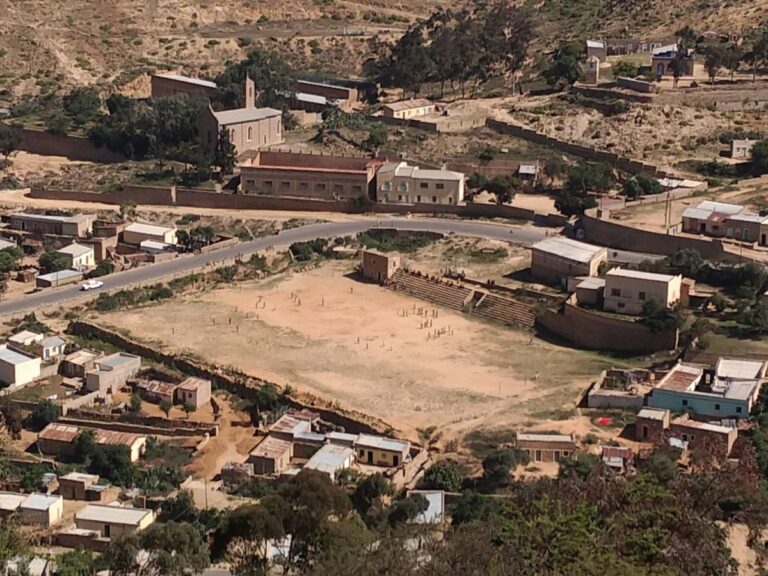
Informal Settlements: The Challenge of Unmapped Spaces
Many informal settlements in Kenya were historically excluded from official maps, making planning difficult. GIS helps close this gap by enabling community mapping. Trained residents use GPS tools or mobile apps to collect data on toilets, schools, or water points. The result is a bottom-up map that reflects real lived conditions.
This participatory mapping not only improves data accuracy but empowers communities to advocate for better services. With their neighborhoods on the map, residents can more effectively demand attention from government agencies and NGOs.
Tools and Technologies Driving GIS in Kenya
GIS is not a single tool but a suite of technologies that work together. In Kenya, both open-source and proprietary platforms are used for spatial data collection, analysis, and presentation.
Affordable and accessible tools are making GIS more widely used, even in low-resource areas.
Popular GIS Platforms and Their Uses
- QGIS – This open-source desktop GIS platform is widely used for spatial analysis, especially by NGOs and universities. It supports plugins and can handle large datasets.
- ArcGIS – While it’s a paid platform, many government agencies and large institutions use ArcGIS for its advanced analytics and polished outputs.
- ODK (Open Data Kit) – Enables mobile-based data collection with GPS location tagging. It’s especially helpful for surveys in rural or informal areas.
- Google Earth Engine – Used for large-scale spatial analysis and remote sensing, especially for environmental and land-use monitoring.
- Mapbox and Leaflet – These tools are used to create interactive web-based maps for public display or mobile viewing.
GPS and Mobile Data Collection
Mobile phones equipped with GPS are now key tools in spatial data collection. Platforms like KoboToolbox and ODK Collect allow surveyors to gather georeferenced data even without internet access. This is crucial for reaching remote or informal settlements with limited connectivity.
In places like Mathare in Nairobi, youth-led groups have used GPS devices and smartphones to log locations of latrines, waste dumps, and informal clinics—providing rich spatial data for sanitation planning.
Real-World Applications of GIS in Kenyan Settlements
The use of GIS in Kenya goes far beyond academic exercises. From local governments to international NGOs, many actors now rely on spatial data to improve service delivery. GIS supports planning that is not only data-driven but also grounded in real-world geography.
Water and Sanitation
Water access is one of the most spatially uneven services in Kenya. GIS has helped map water points in urban slums and identify neighborhoods with long walking distances to clean water. In rural counties like Kitui, GIS is used to track borehole functionality and rainfall patterns to guide well drilling.
By mapping sanitation coverage, public health officials can target areas most at risk of disease outbreaks. For example, during cholera outbreaks, GIS data helps quickly identify hotspots and deploy emergency interventions.
Healthcare Planning
Kenya’s health infrastructure is tiered, from national referral hospitals to community health volunteers. GIS helps identify where each level is missing or overstretched. By mapping health facilities alongside population data, counties can assess whether clinics are optimally located.
In Turkana County, GIS was used to analyze travel times to health centers, revealing that many residents must travel hours by foot. This informed decisions about mobile clinics and new health outposts.
Education Access
The Ministry of Education uses GIS to monitor school access, especially in arid and pastoral regions. In areas like Garissa and Wajir, distance and conflict zones can limit access. GIS maps show which schools are underserved or overcrowded, supporting more equitable allocation of resources.
School mapping has also supported infrastructure upgrades by identifying institutions lacking electricity, water, or sufficient classrooms.
Challenges in Using GIS for Service Planning
While the benefits of GIS are clear, implementation in Kenyan settlements faces several hurdles. These challenges affect both the quality of data and the ability to act on the insights generated.
Data gaps, technical capacity, and political will are key barriers to making full use of GIS in planning.
Incomplete or Inconsistent Data
Many counties lack up-to-date maps of roads, buildings, or service points. Informal areas are especially under-documented. In some cases, data exists but is siloed across departments or in incompatible formats.
Limited Technical Skills
Not all local governments or NGOs have trained GIS staff. Even when software is available, using it effectively requires skills in data cleaning, spatial analysis, and map interpretation.
To address this, initiatives like the GeoYouthMap project train Kenyan youth in basic GIS and mapping skills. Universities are also integrating GIS into urban planning and public health programs.
Lack of Integration into Decision-Making
Data alone does not lead to action. GIS insights must be tied to budget planning, policy, and political priorities. In some cases, mapping projects generate impressive visuals that never influence real-world decisions.
Building stronger links between data analysis and decision-makers—such as county planners or national ministries—is essential to translate GIS into impact.
Toward More Equitable Development: GIS as a Planning Tool
GIS is not just a technical tool—it’s a method for rethinking how services are delivered. By visualizing inequity, it challenges planners and leaders to respond more fairly. When used well, GIS can democratize data and make urban and rural development more inclusive.
Integrating GIS with Community Participation
One of the most promising trends is the merging of GIS with participatory planning. When residents contribute to data collection or map interpretation, the results are more accurate and the solutions more locally relevant.
In Nairobi, Slum Dwellers International (SDI) has trained community mappers who produce detailed settlement maps, which are then used in negotiations with city authorities for upgrading projects.
Planning for Climate and Population Growth
As Kenya faces the twin pressures of climate change and rapid urbanization, GIS will become even more essential. Mapping flood-prone areas, land use changes, and population shifts helps anticipate future service needs before crises emerge.
Counties like Makueni are already using GIS to monitor drought impacts and plan resilient water infrastructure.
GIS for Service Access in Kenyan Settlements: What’s Next?
Understanding service access through GIS gives planners, NGOs, and communities a common language for identifying gaps and prioritizing interventions. As more data becomes available and tools become easier to use, GIS will likely become standard in development planning across Kenya.
The next step is integrating GIS more deeply into budgeting, policy decisions, and community engagement. This means moving from maps on paper to action on the ground.
A future blog might explore how GIS is being linked with budgeting tools or citizen feedback platforms to close the loop between analysis and implementation. The goal remains the same: smarter, fairer, and more inclusive service delivery for all.